
Private fund launches, by the month
Every original Form D filed by a pooled investment fund on EDGAR, counted by month, strategy and state. Nothing here is sampled or estimated. The figures, the CSV and the chart are free to reuse with attribution: "Source: FormDSignal (formdsignal.com/research)".
- 2026-10 (to date)
- 1342
- 2026-09
- 1583
- Same month last year
- 1488
- Median stated size, last month
- $6.5M
Launches per month, all strategies
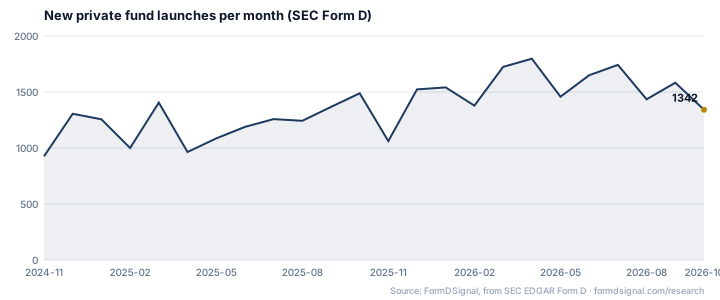
Embed this chart
<img src="https://www.formdsignal.com/research/launches.svg" alt="New private fund launches per month, SEC Form D" width="720" height="300">It updates hourly. Please keep the source line.
By strategy
| Strategy | 25-11 | 25-12 | 26-01 | 26-02 | 26-03 | 26-04 | 26-05 | 26-06 | 26-07 | 26-08 | 26-09 | 26-10 | 12-mo |
|---|---|---|---|---|---|---|---|---|---|---|---|---|---|
| Venture capital | 313 | 451 | 506 | 471 | 548 | 617 | 494 | 548 | 610 | 439 | 445 | 338 | 5780 |
| Private equity / buyout | 314 | 439 | 389 | 374 | 524 | 518 | 428 | 502 | 468 | 474 | 546 | 451 | 5427 |
| Other fund | 226 | 293 | 317 | 293 | 316 | 329 | 286 | 328 | 345 | 264 | 314 | 272 | 3583 |
| Hedge fund | 82 | 124 | 130 | 118 | 159 | 155 | 130 | 104 | 126 | 100 | 141 | 137 | 1506 |
| Private credit | 29 | 40 | 40 | 22 | 43 | 34 | 26 | 40 | 42 | 46 | 28 | 42 | 432 |
| Growth equity | 26 | 49 | 24 | 42 | 44 | 34 | 31 | 30 | 49 | 47 | 35 | 30 | 441 |
| All | 1062 | 1523 | 1541 | 1379 | 1724 | 1797 | 1458 | 1650 | 1742 | 1435 | 1583 | 1342 | 18236 |
Strategy is read from the filing's fund type and the entity name (methodology). The current month is partial.
By state, last 24 months
| State | Launches | First-time managers | Median size |
|---|---|---|---|
| New York | 5,944 | 920 (15%) | $5M |
| Delaware | 4,863 | 541 (11%) | $500K |
| California | 4,241 | 928 (22%) | $19M |
| Texas | 2,675 | 555 (21%) | $3.9M |
| Florida | 1,795 | 514 (29%) | $10M |
| Massachusetts | 1,235 | 187 (15%) | $2M |
| E9 | 981 | 155 (16%) | $25M |
| Illinois | 940 | 211 (22%) | $10.6M |
| N4 | 797 | 101 (13%) | $546.7M |
| Colorado | 700 | 335 (48%) | $40M |
| Washington | 647 | 69 (11%) | $500K |
| Connecticut | 622 | 124 (20%) | $34.9M |
| Pennsylvania | 480 | 95 (20%) | $10M |
| New Jersey | 466 | 162 (35%) | $6M |
| Virginia | 412 | 62 (15%) | $2M |
UK: how many allotments are real rounds
Of 16 UK share allotments (form SH01) whose filing we have read, 44% were priced rounds — shares issued above nominal value — and 44% were priced rounds of £10,000 or more. The rest are founder shares, option exercises and restructurings. Priced rounds in the window total £6,283,393.
| Month | Allotments | Priced | £ raised (priced) |
|---|---|---|---|
| 2026-10 | 16 | 7 | £6,283,393 |
Companies House publishes only nominal capital; the price paid is read from each SH01 form. The UK feed.
Who administers and audits the funds
Full table →From Form ADV Schedule D 7.B.(1), across 103 advisers and 5,010 private funds read so far.
Administrators
- 1.GEN II FUND SERVICES LLC420 funds
- 2.SEI GLOBAL SERVICES INC.253 funds
- 3.SS&C TECHNOLOGIES176 funds
- 4.INTERNATIONAL FUND SERVICES (N.A), LLC153 funds
- 5.STATE STREET BANK AND TRUST153 funds
- 6.U.S. BANK N.A.116 funds
- 7.CITCO FUND SERVICES (CAYMAN ISLANDS) LIMITED102 funds
- 8.AD CARTA, LLC92 funds
- 9.BANK OF NEW YORK84 funds
- 10.SEI INVESTMENTS COMPANY77 funds
Auditors
- 1.ERNST & YOUNG1491 funds
- 2.PRICEWATERHOUSECOOPERS1330 funds
- 3.KPMG849 funds
- 4.DELOITTE AND TOUCHE LLP195 funds
- 5.GRANT THORNTON115 funds
- 6.PLANTE & MORAN, PLLC56 funds
- 7.PRICEWATERHOUSE COOPERS52 funds
- 8.GRASSI & CO.47 funds
- 9.BDO32 funds
- 10.PRICEWATERHOUSECOOPERS CAYMAN ISLANDS32 funds
Reuse: CC BY 4.0 for the figures, the CSV and the chart on this page, with "Source: FormDSignal (formdsignal.com/research)". Questions or a cut you need: [email protected]. The weekly roundups carry the same counts week by week.